
The Tourism Training Unit is mandated to develop and carry out a range of planning, research and training tasks. In this regard some activity areas of the unit are as follows:
In order to facilitate activity one (1), as stated above, a needs assessment was conducted to assess the training needs of the tourism industry in Belize. The main purpose of the analysis was to determine the best initial offering of courses for the Tourism Training Unit. This was accomplished by analyzing the current and future training needs of all sectors of the tourism industry. The assessment is based on a survey of 652 responding entities in the tourism industry.
The objectives of the assessment were to:
652 tourism establishments countrywide completed the needs assessment questionnaires. These establishments were either given a questionnaire at one of the presentations that the Unit made to the different tourism organizations, via email, fax or by individual visits from 15 interviewers who were hired to administer the survey. The questionnaires were divided into three sections. The first section looks at the institution, the second looks at the training needs and the third looks at the staff of the respondents. Sections one and two were mandatory but the third section was optional.
Besides the six districts, Placencia, Caye Caulker and San Pedro were included as separate destinations. Table 1 shows a breakdown of the number of questionnaires that were completed at the nine destinations throughout the country.
Table 1: Answers received by destination
| Destination | Amount | Percent |
| Belize City | 78 | 12.0 |
| Caye Caulker | 102 | 15.6 |
| Cayo | 65 | 10.0 |
| Corozal | 46 | 7.1 |
| Orange Walk | 16 | 2.5 |
| Placencia | 95 | 14.6 |
| Punta Gorda | 61 | 9.4 |
| San Pedro | 74 | 11.3 |
| Stann Creek | 115 | 17.6 |
| Total | 652 | 100.0 |
For the purposes of this assessment nine tourism types were used as a breakdown of the different sectors of the industry. Representatives from the Accommodation and Food and Beverage sectors completed almost 65% of the questionnaires with only .3% response from Tourism Education and Training centers. Table 2 shows the number of respondents from the all nine sectors.
Table 2: Type of Organisation
| Organisation | Amount | Percent |
| Accommodation | 268 | 41.1 |
| Food and Beverage | 154 | 23.6 |
| Adventure Tourism | 30 | 4.6 |
| Transportation | 50 | 7.7 |
| Travel Trade | 48 | 7.4 |
| Events and Conferences | 3 | .5 |
| Attractions | 12 | 1.8 |
| Tourism Services | 11 | 1.7 |
| Tourism Education and Training | 2 | .3 |
| other | 74 | 11.3 |
| Total | 652 | 100.0 |
In an effort to determine the age of tourism establishments in Belize and to see if there is correlation between the age of an operation and the training needs of that establishment the third question ask about the age of the establishment. Fifty-two percent of the responding organizations were five years or less and about 8% were over 21 years old. Table 3 shows the number of years that the establishments have been in existence. Please note that establishments under a year old are labeled as one year and all other responses are rounded up or down if over or below six months.
Table 3: Age of Operation
| Years | Amount | Percent |
| 0-5 years | 322 | 51.6 |
| 6-10 years | 150 | 24.0 |
| 11-15 years | 65 | 10.4 |
| 16-20 years | 45 | 7.2 |
| 21< years | 42 | 6.7 |
| Total | 624 | 100.0 |
The respondents reported employing a total of 3,612 full-time and part-time workers. Table 4 shows the staff profile of the organizations interviewed. This profile includes the employment status and the sex breakdown of the respondents.
Table 4: Staff Profile
| Count | Percent | |
| Staff by Category | ||
| Managerial | 836 | 23 |
| Professional non-managerial | 348 | 10 |
| Skilled/semi-skilled | 1517 | 42 |
| Unskilled | 911 | 25 |
| Staff by full-time/part-time | ||
| Full-time permanent | 3135 | 87 |
| Full-time temporary | 133 | 4 |
| Part-time | 321 | 9 |
| Staff by sex | ||
| Male | 1736 | 49 |
| Female | 1818 | 51 |
| Table 5 details the type of training that is currently being used by the establishments that were interviewed. By far the most popular mode of training is on the job training. 86% of the respondents use this method to train their staff, 20% use in-house classroom training, 6% use the services of an external trainer, 13% sends their employees to local training institutions and only 5% use outside training institutions. | Table 5: Current Type of training
|
|||||||||||||||||||||
| The most popular time for conducting training is during the daytime (42% of the respondents) with training on weekend (90%) as the least favorable. The breakdown of this can be seen on Table 6. | Table 6: Preferred time for training
|
Table 7 shows preference for the different types of training. This table shows that almost 98% of the respondents stated that it is important to conduct on-the-job training. When asked about the percent of budget that is allocated to training, 63% indicated that they do not budget for training, 28% said they use 1-5% of their budget for training and 9% budgeted 5-10% for training.
Table 7: Importance of Training Type
| Important | Not important | |||
| Type of Training | Amount | Percent | Amount | Percent |
| On the job | 593 | 99 | 5 | 1 |
| In-house classroom | 411 | 86 | 67 | 14 |
| External trainers | 355 | 76 | 113 | 24 |
| Local tourism training institutions | 292 | 69 | 133 | 31 |
| Regional tourism training institutions | 265 | 63 | 155 | 37 |
| International tourism training institutions | 250 | 59 | 173 | 41 |
The main purpose of this assessment was to determine tourism training needs as reported by the industry itself In order to do so, respondents were asked to indicate “all major training needs” among the various categories of staff. This section detail the major training needs identified by the responding organizations.
Tables 8, 9, 10, and 11 show the training needs identified at the Managerial, Professional, Skilled/semi-skilled and Unskilled levels. The first six courses at each level will be developed and offered over the first year of the project. At the Managerial level the courses are Customer Relations, Marketing, Leadership skills, Financial/Accounting, Communications and Human Resources Management. At the Professional level the courses are Customer Relations, Communications, Financial Accounting, a Foreign Language, Computer Skills and Marketing. At the Skilled/semi- skilled level the courses that will be developed are Customer Relations, Communications, Culinary Skills, Computer Literacy, Foreign Language and Financial Accounting. And at the Unskilled level the courses that will be developed are Customer Relations, Communications, House Keeping, Foreign Language, Waitering, and Culinary Skills. Across all four levels there were some common trends, the need for training in Customer Relations and Communications.
Table 8: Training Needs at the Managerial Level
| Training Needs | Amount | Percent |
| Customer Relations | 197 | 30 |
| Marketing | 156 | 24 |
| Leadership | 155 | 24 |
| Financial/Accounting | 121 | 19 |
| Communications | 120 | 18 |
| Human Resource Management | 97 | 15 |
| Management | 90 | 14 |
| Computer Literacy | 87 | 13 |
| Foreign Language | 72 | 11 |
| Tour Guiding | 36 | 6 |
| Hospitality | 21 | 3 |
| Technical Skills | 18 | 3 |
| Product Knowledge | 16 | 3 |
| Fishing Skills | 13 | 2 |
| House Keeping | 13 | 2 |
| Catering | 12 | 2 |
| Marine Navigating | 12 | 2 |
| Waitering | 11 | 2 |
| First Aid | 10 | 2 |
Table 9: Needs at the Professional Level
| Training Needs | Amount | Percent |
| Customer Relations | 119 | 18 |
| Communications | 93 | 14 |
| Financial/Accounting | 47 | 7 |
| Computer Literacy | 39 | 6 |
| Marketing | 39 | 6 |
| Leadership | 30 | 5 |
| Technical Skills | 20 | 3 |
| Driving | 18 | 3 |
| Waitering | 17 | 3 |
| Hospitality | 15 | 2 |
Table 10: Needs at the Skilled/Semi-Skilled Level
| Training Needs | Amount | Percent |
| Customer Relations | 180 | 28 |
| Communications | 125 | 19 |
| Culinary Skills | 76 | 12 |
| Computer Literacy | 58 | 9 |
| Foreign Language | 56 | 9 |
| Financial/Accounting | 38 | 6 |
| Leadership Management | 33 | 5 |
| Marketing | 31 | 5 |
| Tour Guiding | 31 | 5 |
| Bar Tending | 23 | 4 |
| Waitering | 13 | 2 |
| Technical Skills | 13 | 2 |
| Marine Navigation | 12 | 2 |
| Driving | 11 | 2 |
Table 11: Training Needs at the Unskilled Level
| Training Needs | Amount | Percent | Training Needs | Amount | Percent |
| Customer Relations | 130 | 20 | Computer Literacy | 18 | 3 |
| Communications | 106 | 16 | Financial/Accounting | 17 | 3 |
| House Keeping | 41 | 6 | Bar Tending | 16 | 3 |
| Foreign Language | 37 | 6 | Hospitality | 15 | 2 |
| Waitering | 31 | 5 | Landscape Upkeep | 14 | 2 |
| Culinary Skills | 25 | 4 | Driving | 12 | 2 |
| Leadership | 25 | 4 | Diving | 11 | 2 |
| Tour Guiding | 20 | 3 | Maintenance | 11 | 2 |
| Human Resource Management | 19 | 3 | Technical Skills | 10 | 2 |
| Marketing | 19 | 3 | Swimming Pool Operation | 9 | 2 |
When looking at the type of training that is currently being undertaken by the various sectors of tourism operation, “On the job training” is used the most across all sectors. In the accommodation sector, 90% use on the job training, 18% use in-house classroom training, 7% use external trainers, 14% use local tourism training institutions, 3% use regional tourism training institutions, and 3% uses international tourism training institutions. This trend was similar across the different sectors of tourism operations. Table 12 shows the breakdown.
Table 12: Type of Training used by different sectors of Tourism Operations (percent)
| Type | On the job | In-house classroom | External trainers | Local institutions | Regional institutions | International institutions |
| Accommodation | 90 | 18 | 7 | 14 | 3 | 3 |
| Food and Beverage | 94 | 18 | 1 | 4 | 1 | 0 |
| Adventure Tourism | 86 | 27 | 3 | 33 | 7 | 3 |
| Transportation | 88 | 16 | 8 | 20 | 0 | 4 |
| Travel Trade | 73 | 23 | 10 | 40 | 8 | 10 |
| Events and Conferences | 68 | 0 | 33 | 0 | 0 | 0 |
| Attractions | 75 | 25 | 8 | 8 | 0 | 0 |
| Tourism Services | 73 | 27 | 18 | 9 | 0 | 0 |
| Education and Training | 50 | 0 | 0 | 0 | 0 | 50 |
When a cross tabulation was run to determine the preferred training time by the type of tourism operations there was no difference across the nine sectors in their preference for daytime training during the week with training during the evening hours following closely. Training on the weekends seems to be the least attraction of the three options. Table 13 provides the detail.
Table 13: Training Time used by Types of Operations (percent)
| Type | Daytime | Evening | Weekends |
| Accommodation | 41 | 36 | 8 |
| Food and Beverage | 43 | 31 | 10 |
| Adventure Tourism | 43 | 37 | 3 |
| Transportation | 42 | 40 | 4 |
| Travel Trade | 58 | 38 | 4 |
| Events and Conferences | 0 | 100 | 0 |
| Attractions | 50 | 36 | 17 |
| Tourism Services | 36 | 50 | 18 |
| Education and Training | 0 | 34 | 0 |
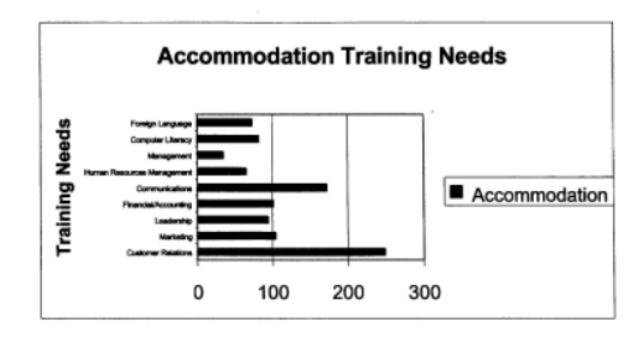
Table 14 provides a detailed breakdown of the training needs across the tune sectors of tourism. This information will guide the Unit to target its marketing efforts to the right sector. For example, the table shows that 249 people from the accommodation sector would like training in Customer Relations and from this number, 77 are from the managerial level, 45 from the professional level, 70 from the semi-skilled level and 57 from the unskilled. This breakdown can be shown for all the training needs across every sector.
Table 15 shows the training needs of the nine destinations. This information will be provided to the District Tourism Trainers who will use this to know whom to approach for training.

The results of the needs assessment study suggest several potential areas of emphasis for tourism training. The nine most desired programs that the industry is calling for are customer relations, marketing, leadership, financia/accounting, communications, human resources management, management, computer literacy and foreign language. These programs ranked the highest across the nine sectors of tourism and across the four levels of employment.
Most responses came from the Stann Creek District (17.6% of the total amount) and the least from Corozal (7.1%). The accommodation sector of tourism had the most responses (41.1%) and the Tourism Education and Training Institutions had the least (.3%). Of the establishments that participated in the survey 86% currently conduct on the job training and 99% stated that this type of training is important. The least used type of training is the sending of employees to international training institutions (3%). During the daytime is the preferred time for training with the weekends being least preferred.
© Vincent Palacio, 2003.
 HTML last revised 9th May 2003.
Return to Conference Papers.